Protein Concentration Calculator: Methods, Formula & Examples
Calculate protein concentration from mass and volume, A280 absorbance, C1V1 dilutions, or linear standard curves used in Bradford, BCA, and Lowry assays — with a free multi-mode calculator.
Measuring protein concentration is a core step in biochemistry, molecular biology, proteomics, and many clinical or industrial workflows. Whether you are normalizing samples for SDS-PAGE, loading equal protein into ELISA wells, preparing enzyme assays, or reporting purification yields, you need a reliable way to turn mass, volume, absorbance, or assay readings into concentration.
The free Protein Concentration Calculator on CalcWisee supports four practical modes: mass ÷ volume (C = m/V), A280 Beer–Lambert with extinction coefficient and dilution, C₁V₁ = C₂V₂ stock dilutions, and linear standard-curve math used with Bradford, BCA, and Lowry assays.
This guide explains what protein concentration means, the main laboratory methods, the formulas behind each mode, worked examples, unit conversions, common mistakes, and how to use the calculator safely as an educational aid — not a replacement for validated laboratory protocols.
Try it right here — results update instantly.
Protein Concentration Calculator
Mass/volume · A280 · dilution · Bradford/BCA/Lowry curve
Result
3 mg/mL
(3,000 µg/mL · 3 g/L)
C = m ÷ V. Keep mass and volume units consistent (converted internally to mg and mL).
Read the Protein Concentration Calculator guide
Educational laboratory calculation aid only. A280 extinction coefficients and colorimetric assays are method-dependent. Results do not replace validated SOPs, instrument calibration, kit instructions, or professional laboratory judgment.
What Is Protein Concentration?
Protein concentration is the amount of protein present in a given volume of solution. It is most often reported as mg/mL (milligrams per milliliter), µg/mL (micrograms per milliliter), or g/L (grams per liter). Numerically, **1 mg/mL = 1 g/L = 1000 µg/mL**.
Unlike a pure small-molecule solute with a single known molecular weight and chromophore, “protein” in a sample may be a purified recombinant product, a complex lysate, serum, or a mixture. Method choice (UV A280 vs dye-binding assay) and the standard used (for example BSA) therefore matter as much as the arithmetic.
Why Protein Concentration Matters
- Equal protein loading for gels, blots, and comparative omics.
- Enzyme kinetics and specific activity (activity per mg protein).
- Antibody and antigen working dilutions.
- Purification yield and fold-enrichment calculations.
- Formulation, stability, and quality-control checks in research settings.
Using the wrong concentration can bias downstream results even when every other step is careful. Always pair calculation with appropriate blanks, standards, and instrument settings from your SOP.
Basic Formula: C = m / V
When you already know the protein mass and the solution volume, concentration is simply mass divided by volume:
**C = m ÷ V**
Example: 12 mg of lyophilized protein dissolved and brought to 4 mL gives **C = 12 ÷ 4 = 3 mg/mL** (also 3000 µg/mL or 3 g/L). In the calculator, choose **Mass ÷ Volume** and select matching mass and volume units; the tool converts internally to mg and mL.
Unit consistency
Beer–Lambert Law and A280 Absorbance
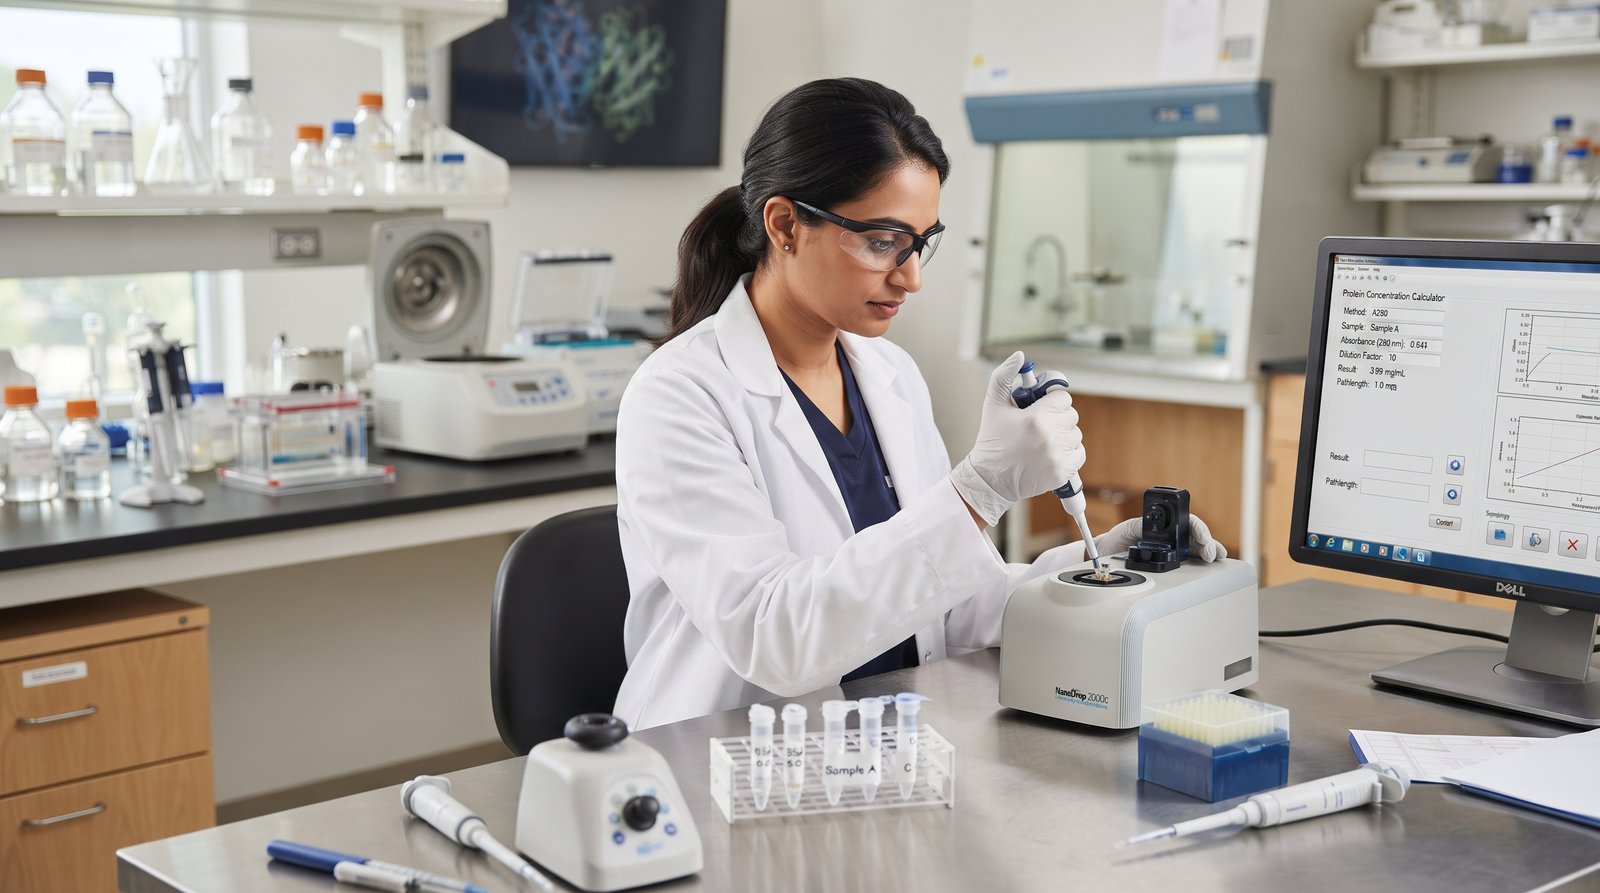
Many purified proteins absorb ultraviolet light near **280 nm** because of tryptophan, tyrosine, and (to a lesser extent) disulfide bonds. The Beer–Lambert law relates absorbance to concentration:
**A = ε × c × l**
Rearranged for concentration with an optional dilution factor (DF):
**c = (A₂₈₀ × DF) ÷ (ε × l)**
- **A₂₈₀** — blank-corrected absorbance at 280 nm (dimensionless absorbance units).
- **ε** — extinction (molar absorptivity) coefficient. Often in (mg/mL)⁻¹cm⁻¹ or M⁻¹cm⁻¹.
- **l** — optical path length in cm (1 cm for many cuvettes; micro-volume readers may path-length correct).
- **DF** — dilution factor (≥ 1). Multiply so the result refers to the undiluted sample.
Choosing ε
Prefer a **protein-specific** coefficient from sequence prediction (e.g. ProtParam-style estimates) or literature. For rough mixed-protein estimates some labs use **ε ≈ 1.0 (mg/mL)⁻¹cm⁻¹**, but that is only an approximation. When ε is molar (M⁻¹cm⁻¹), also supply molecular weight so concentration can be reported in mg/mL: **c (mg/mL) = c (M) × MW (g/mol)**.
Worked A280 example
A280 = 0.541, ε = 1.0 (mg/mL)⁻¹cm⁻¹, path = 1 cm, dilution = 10×:
**c = (0.541 × 10) ÷ (1.0 × 1) = 5.41 mg/mL**
Use the calculator’s **A280 / Beer–Lambert** mode with the same inputs to verify.
Dilution Calculations (C₁V₁ = C₂V₂)
To prepare a working solution from a stock:
**C₁V₁ = C₂V₂ → V₁ = (C₂ × V₂) ÷ C₁**
Example: stock 10 mg/mL, want 1 mL at 1 mg/mL → V₁ = (1 × 1) ÷ 10 = **0.1 mL stock** + **0.9 mL diluent**. Dilution factor = 10×. The calculator’s **Dilution** mode accepts mg/mL, µg/mL, g/L, and µg/µL with µL or mL final volumes.
Colorimetric Assays: Bradford, BCA, and Lowry
When UV A280 is unsuitable (low Trp/Tyr content, strong buffer absorbance, complex lysates), dye- or copper-based assays are common:
- **Bradford (Coomassie Brilliant Blue G-250)** — rapid; dye binding shifts absorbance (often ~595 nm). Sensitive to detergent and some protein composition differences vs BSA standards.
- **BCA (bicinchoninic acid)** — Cu²⁺ reduction; often read near 562 nm. Compatible with many detergents; reducing agents can interfere.
- **Lowry** — classic Folin–Ciocalteu chemistry; sensitive but more steps and interference-prone.
Standard curve math
Run known standards (often BSA), blank-correct absorbances, and fit a linear model in the working range:
**A = m · c + b** → **c = (A − b) ÷ m**
If the sample was diluted before the assay, multiply by the dilution factor to report the original concentration. Units of **c** match the standards (frequently µg/mL). Stay inside the linear range; do not extrapolate blindly.
Example: slope m = 0.85, intercept b = 0.05, sample A = 0.72, DF = 1 → c = (0.72 − 0.05) ÷ 0.85 ≈ **0.788** (same units as standards).
Assay caveats
Unit Conversion Table
| From | To | Multiply by |
|---|---|---|
| mg/mL | µg/mL | 1,000 |
| mg/mL | g/L | 1 |
| mg/mL | µg/µL | 1 |
| µg/mL | mg/mL | 0.001 |
| g/L | mg/mL | 1 |
| ng/µL | µg/mL | 1 |
| µg/µL | mg/mL | 1 |
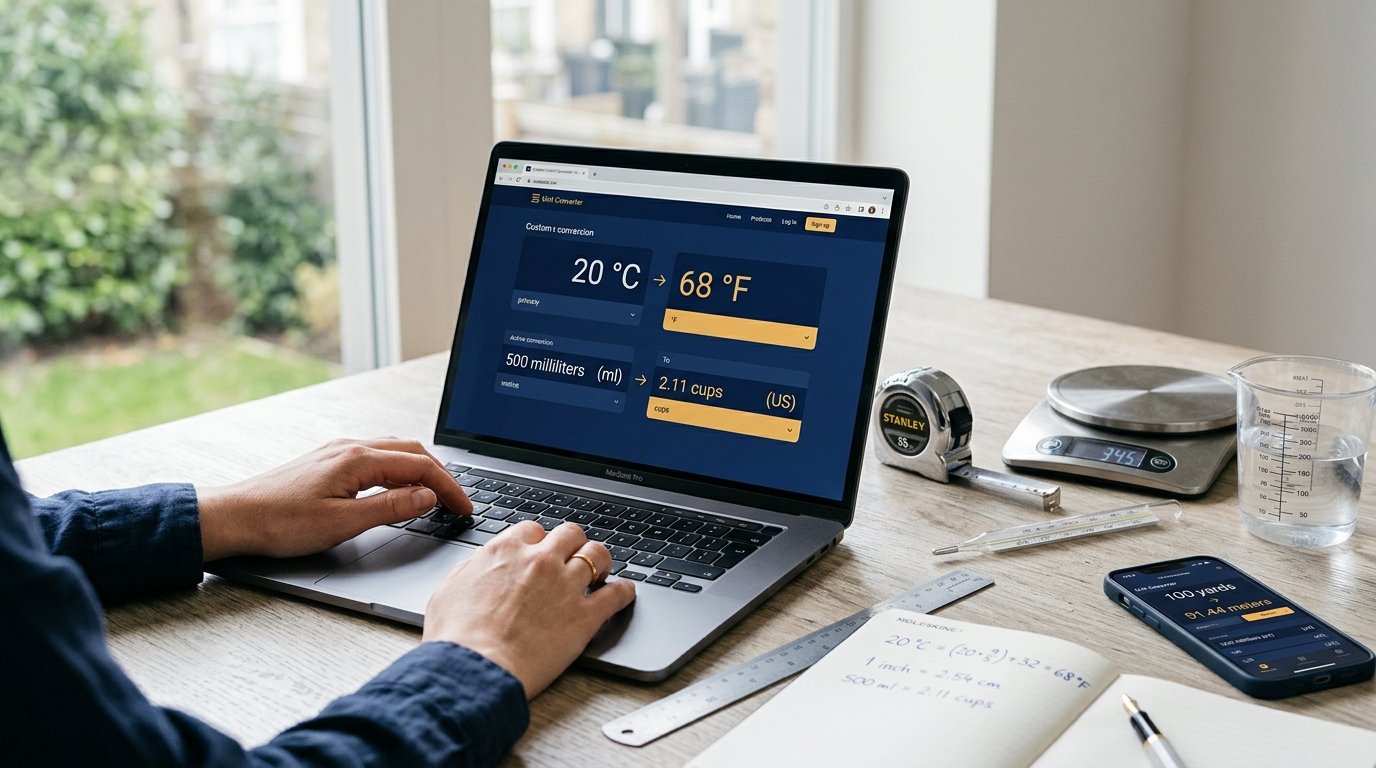
For mixed unit chores beyond protein concentration, use the Unit Converter and the Conversion Calculators hub.
How to Use the Protein Concentration Calculator
- 1Open the Protein Concentration Calculator.
- 2Select a mode: Mass ÷ Volume, A280 / Beer–Lambert, Dilution (C₁V₁), or Standard curve.
- 3Enter values with the unit selectors. Decimals and scientific notation (e.g. 1.2e-3) are accepted.
- 4Review the primary result and breakdown rows (mg/mL, µg/mL, dilution volumes, or curve-derived concentration).
- 5Use Reset to restore defaults. Fix any validation message before trusting a number.
All math runs locally in your browser. Nothing is uploaded. Still treat outputs as educational estimates and confirm critical work with calibrated instruments and approved SOPs.
Practical Laboratory Examples
Example 1 — Mass and volume
A vial contains 2.5 mg protein reconstituted to 500 µL. C = 2.5 mg ÷ 0.5 mL = **5 mg/mL**.
Example 2 — A280 with molar ε
A280 = 0.88, ε = 43,824 M⁻¹cm⁻¹, MW = 66,000 Da, l = 1 cm, DF = 1. c (M) = 0.88 / 43824 ≈ 2.01×10⁻⁵ M; c (mg/mL) ≈ 2.01×10⁻⁵ × 66,000 ≈ **1.32 mg/mL**.
Example 3 — Bradford curve with dilution
Standards fit A = 0.012·c + 0.02 with c in µg/mL. Sample diluted 5× reads A = 0.38. Assay c = (0.38 − 0.02) / 0.012 ≈ 30 µg/mL; stock ≈ 30 × 5 = **150 µg/mL** (0.15 mg/mL).
Common Mistakes to Avoid
- Forgetting the dilution factor after measuring a diluted cuvette or plate well.
- Using path length = 1 cm when the instrument already reports path-length-corrected absorbance (or vice versa).
- Applying a generic ε = 1.0 to a protein with very different aromatic content.
- Reading outside the linear range of a Bradford/BCA/Lowry curve.
- Mismatched blank (buffer, detergent, or reducing agent present in samples but not blanks).
- Confusing mg/mL with µg/mL by a factor of 1,000.
- Treating calculator output as a certified analytical result without method validation.
Required Inputs by Mode
| Mode | Required inputs | Primary output |
|---|---|---|
| Mass ÷ Volume | Mass, volume (+ units) | mg/mL (and µg/mL, g/L) |
| A280 Beer–Lambert | A280, ε, path length, DF (+ MW if molar ε) | mg/mL |
| Dilution C₁V₁ | C₁, C₂, V₂ (+ units) | V₁ stock and diluent volumes |
| Standard curve | Slope m, intercept b, sample A, DF | Assay and stock concentration |
Protein vs DNA Quantification
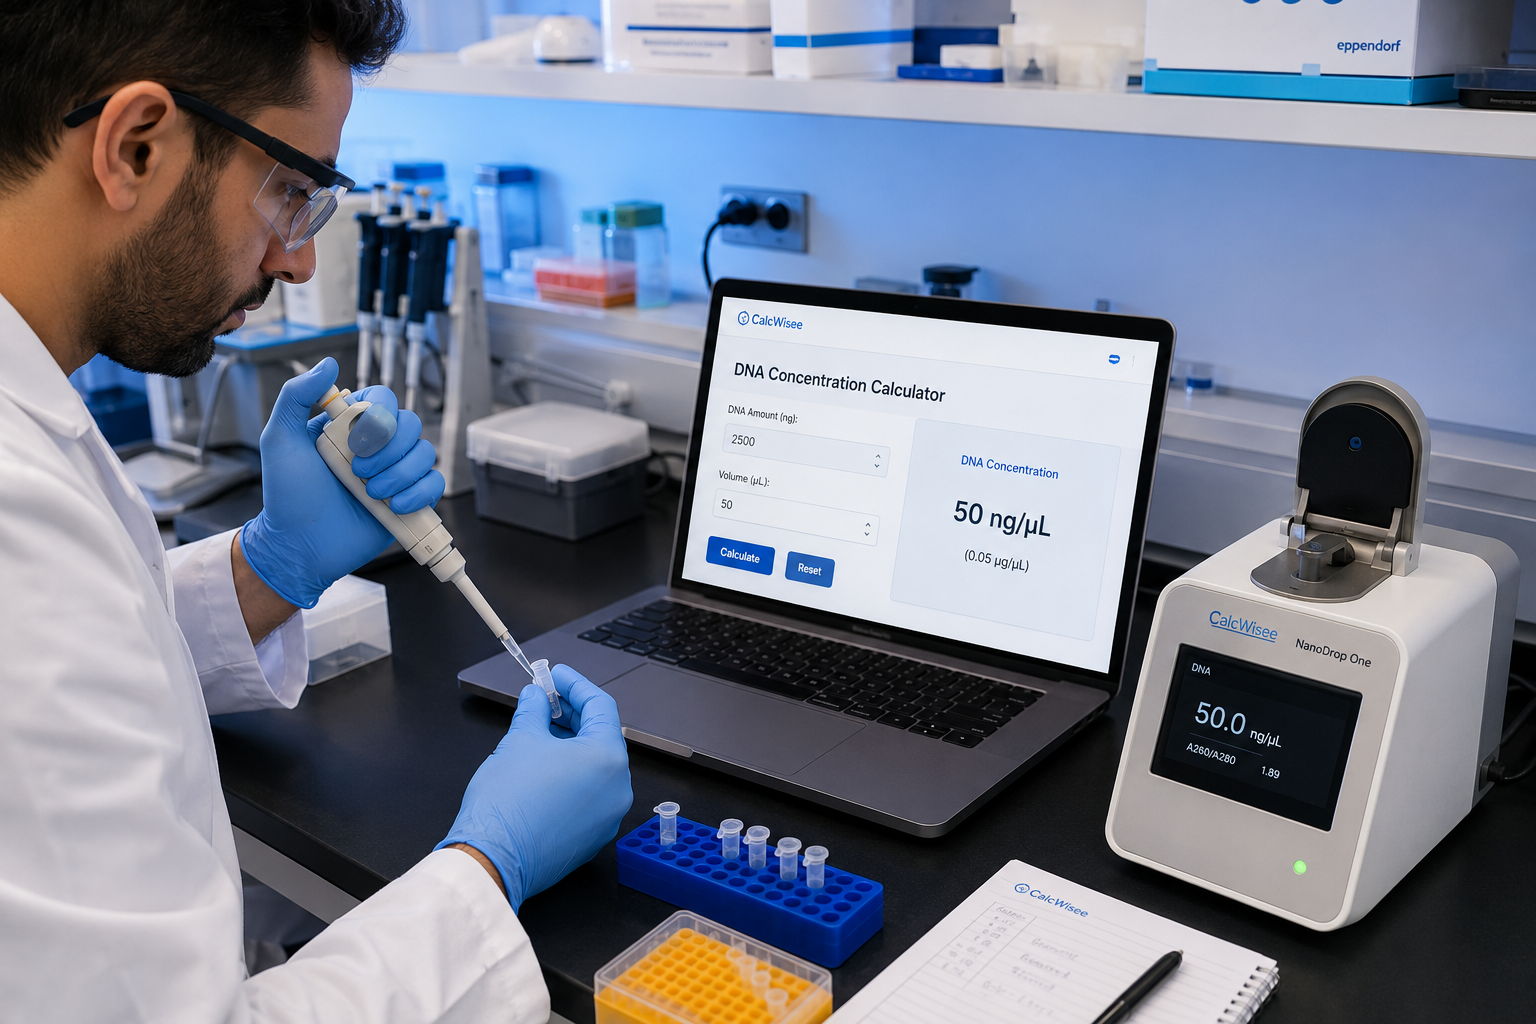
DNA is often estimated at **A260** with nucleic-acid reference factors (e.g. ~50 µg/mL dsDNA at A260 = 1). Protein UV work centers on **A280** and protein-specific ε, or on dye assays with protein standards. If you also quantify nucleic acids, pair this guide with the DNA Concentration Calculator and the article How to Calculate DNA Concentration.
Scientific Disclaimer
Educational use only
Frequently Asked Questions
How do you calculate protein concentration from mass and volume?
Divide mass by volume: C = m ÷ V. Example: 12 mg in 4 mL = 3 mg/mL. Convert units so mass and volume are consistent, or use the Mass ÷ Volume mode.
What is the Beer–Lambert formula for A280 protein measurements?
A = ε × c × l, so c = (A280 × dilution factor) ÷ (ε × path length). Use a protein-specific extinction coefficient when available.
What units should I use for protein concentration?
mg/mL is common in biochemistry. 1 mg/mL = 1 g/L = 1000 µg/mL. Match the units expected by your protocol.
When should I use Bradford, BCA, or Lowry instead of A280?
When the sample has low aromatic content, strong UV-absorbing buffers, or is a complex mixture where dye- or copper-based assays with a standard curve are preferred.
How does the standard-curve mode work?
Enter the linear fit A = m·c + b from your standards, the blank-corrected sample absorbance, and any dilution factor. Concentration c = (A − b) ÷ m, then multiply by DF for the undiluted sample.
What extinction coefficient should I enter?
Use the sequence- or literature-derived ε for your protein. For molar ε (M⁻¹cm⁻¹), also enter molecular weight so the calculator can report mg/mL. Avoid generic values for critical work.
Can I enter scientific notation?
Yes. Values such as 1.5e-2 are accepted. Invalid, negative (where disallowed), zero (where disallowed), or non-finite inputs show clear error messages instead of NaN or Infinity.
Does the calculator store my data?
No. Calculations run locally in your browser for privacy.
Is this a substitute for a validated lab method?
No. It is an educational calculator. Follow calibrated instruments, kit protocols, and institutional methods for research or regulated applications.
References and Further Reading
- Beer, A. (1852). Bestimmung der Absorption des rothen Lichts in farbigen Flüssigkeiten. Annalen der Physik — foundational absorbance–concentration relationship.
- Bradford, M. M. (1976). A rapid and sensitive method for the quantitation of microgram quantities of protein utilizing the principle of protein-dye binding. Analytical Biochemistry, 72, 248–254.
- Smith, P. K., et al. (1985). Measurement of protein using bicinchoninic acid. Analytical Biochemistry, 150, 76–85 (BCA method).
- Lowry, O. H., et al. (1951). Protein measurement with the Folin phenol reagent. Journal of Biological Chemistry, 193, 265–275.
- Pace, C. N., et al. (1995). How to measure and predict the molar absorption coefficient of a protein. Protein Science — guidance on ε estimation.
- NIST and instrument manufacturer documentation for spectrophotometer path length, stray light, and wavelength accuracy.
Related CalcWisee Tools
- Protein Concentration Calculator — multi-mode lab tool
- DNA Concentration Calculator — A260, amount/volume, dilutions
- Cell Dilution Calculator — general C1V1 helper
- Unit Converter — metric and lab unit conversions
- Conversion Calculators — full conversions hub
- Biology Calculators — genetics, lab, animals, plants
- CalcWisee home — all calculator categories
Conclusion
Protein concentration can be obtained from **C = m/V**, from **A280** via the Beer–Lambert law with a suitable extinction coefficient, from **stock dilutions** with C₁V₁ = C₂V₂, or from **linear standard curves** used in Bradford, BCA, and Lowry assays. Each path needs consistent units, honest blanks, and awareness of method limits.
Use the free Protein Concentration Calculator to check arithmetic quickly, explore the worked examples above, and cross-link with DNA quantification and unit conversion tools when your workflow spans multiple sample types. Always finish with your laboratory’s validated protocol.
Try it yourself
Put this guide into practice with our free tool.
CalcWisee Editorial Team
Calculator development and formula review
CalcWisee is an independent site founded by Ayman. Every calculator is built from a published formula or official definition, tested against hand-worked examples before it goes live, and corrected promptly when a reader reports an issue to ayman@calcwisee.com.
Expertise: Financial mathematics, Health and fitness formulas, Applied mathematics, Unit conversion standards